Historically obtaining timely and accurate market sizing data for the U.S. triathlon space is challenging. The largest subset of information resides in the USA Triathlon database, which currently has race results from 2010 to 2024. Athlinks, which is owned by Lifetime, has a broader range of data that includes both USAT and non-USAT data. The Athlinks data, while extensive and very useful, is incomplete as it is greatly dependent on what has been submitted or collected. The scope of this analysis is data from races who have used USA Triathlon insurance, but that is only part of the overall market. In the second half of 2025, we will produce available data for the rest of the market including the Spudman Triathlon, which requires a lottery to fill its 2400 spots, and the Houston Kids Triathlon which had 1500+ participants in 2024. The Cal Tri Events series- which we produce- is another example.
Without the right information, the entire ecosystem that supports multisports, including race directors, registration companies, timing companies and brands are limited in having a consistent knowledge base. For example, during an October 2024 Breakfast with Bob interview with Ironman CEO Scott DeRue, the topic of US participation was discussed. Speaking to numbers shared by USAT, DeRue stated that, "prior to the pandemic there were about 3,000 triathlons of all different flavors, shapes and sizes in the U.S. Today there are 3,000." While this is how it was defined by USAT, if you look at the number of overall events, there were actually 1,100 (2019) and 996 (2024). Additionally, during that period, a 13% decline of 46,660 finishers between 2019 and 2024 also took place. This shows that even how events and races are defined can cause potential debates in the industry. The whole sport benefits when key stakeholders in the industry are speaking the same language and have access to accurate information.
In 2019 the New York Times estimated that triathlon was down 25% from its peak in Triathlons Fight Decline and Seek Ways to Attract the Young. In response- in what was probably a missed opportunity to quantify the U.S. market size for their readers- Triathlete Magazine's Kelly O'Mara penned The Truth About Triathlon Participation in the United States, concluding, "the message got lost in a headline and opener of doom and gloom, and some facts that lacked nuance and proper sourcing. Yes, participation is down from its peak, but is not in free fall; we've been seeing signs of a leveling out and recent gains that signal a more positive future than that story credited." They took USA Triathlon CEO Rocky Harris at face value when he indicated that triathlon participation was starting to increase. "We're now seeing that trend change." In fact the NY Times' 25 percent decline estimate was conservative as it was actually 38%. In an increasingly data driven world, there is demand for quantitative research and analysis.
Victoria Brumfield, USA Triathlon CEO shared "The stability and growth of events is core to the health of the multisport ecosystem and is the primary focus of our organization. There have been constrictions in the sport since the early 2010's, and yet the sport is still strong with many areas of growth including new athletes coming into the sport, increased growth from younger age groups, and race directors adding more formats and races to their weekend events, creating new opportunities for participation. We are optimistic for the future of the sport." We want to thank Victoria and Krista Prescott, USA Triathlon Chief Marketing and Growth Officer for participating in a great discussion about the state of the sport and sharing their vision for the future.
As a reminder, the scope of this analysis is exclusively USA Triathlon data. All data was independently gathered from public sources – this was not provided by USA Triathlon or directly from USA Triathlon insured events. Special thanks to Ben McClure, a recent Washington and Lee University graduate with a Bachelor's in Physics and Economics, who conducted the data collection and analysis behind the project. This builds on the fine work by Nathan Danielson in 2019-2020.
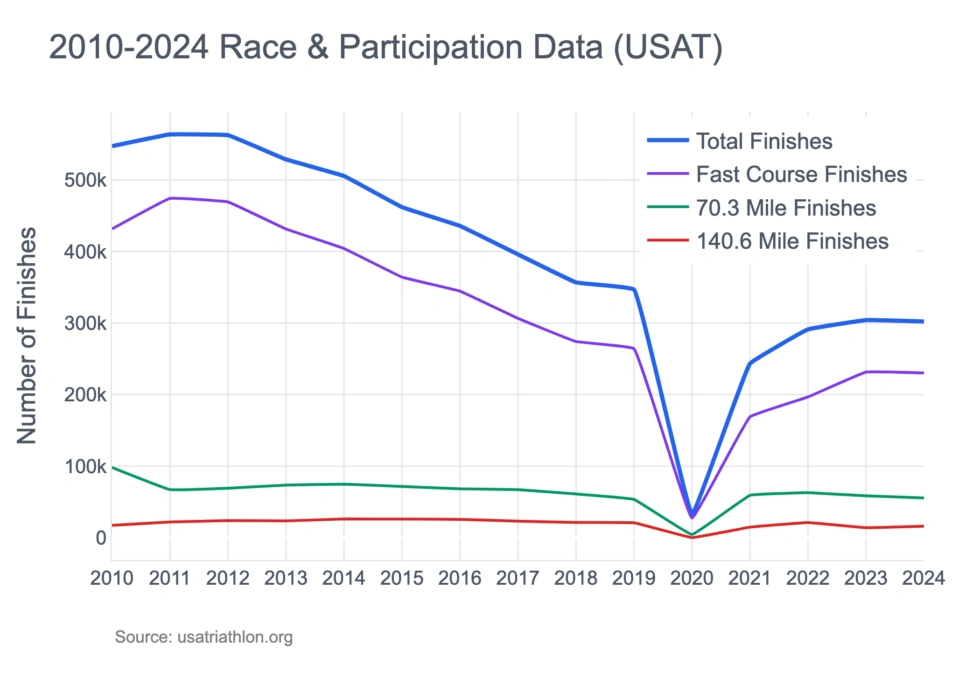
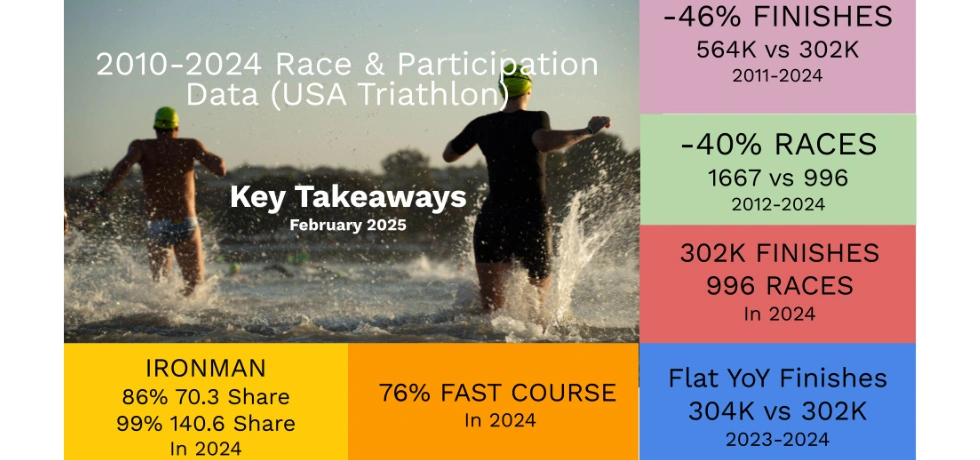
- 46% Finisher Decline From 2011 to 2024: 564K (2011) vs 302K (2024). The number of finishes decreased by 46% from their peak of 564K in 2011 to 302K in 2024. When considering the 349K finishers in 2019, 82% of the decline was pre-pandemic, confirming that an overwhelming majority of the decline was prior to 2020. On a brighter note, the most recent year over year data- 2023-2024- is relatively flat at about 300K finishes. Flat is the new up.
"The most positive thing that can be taken from the data is the relatively flat overall participation shown the past two years, suggesting the possibility of a trough. Like a plane that's been in a nosedive for ten years, let's hope that we've finally bottomed out." remarked Sean Ryan. Ryan has an MBA in Market Research from Northwestern University and is the race director of the Door County Triathlon, which had 1811 finishes in 2024 and has mostly withstood the significant declines felt throughout the industry.
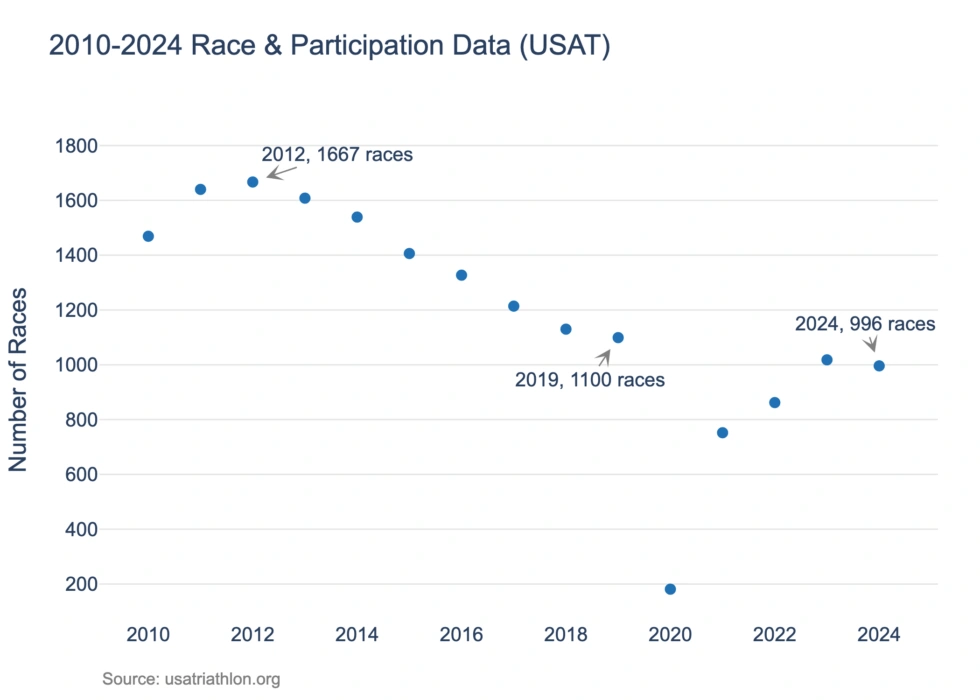
- 40% Decline In Races From 2012 to 2024: 1667 (2012) vs 996 (2024). The number of USA Triathlon insured races shrank from 1667 at the 2012 peak to 996 in 2024, a 40% decline. USAT Triathlon currently describes the 996 races as 3500 events and races by totalling the number of races and events held at those races. It is the equivalent of a Major League Baseball team's 162 game season being described as 1620 innings and games (162 games \+ 1458 innings). In 2024 the average number of events, e.g. triathlon, runbikerun, swimbike, at a race was 2.5 per race compared with 1.7 events per race in 2012. There were more choices, but that didn't significantly change the trajectory of the overall finisher numbers.
- 51.5% Finisher Decline In Fast Course or Short Course From 2011 to 2024: 474K (2011) vs 230K (2024). While still representing 76% of all finishes, the fast course sprint and olympic distances, the welcome mat into the sport, has experienced the largest decline. From the peak in 2011, there are 40% less fast course races and average attendance has shrunk from 301 to 246 (2024).
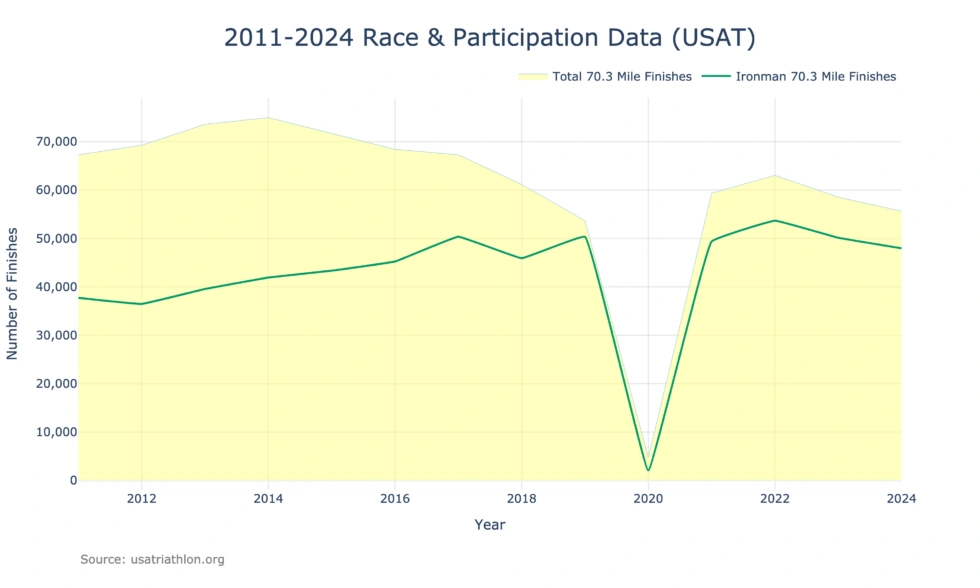
- 26% Finisher Decline in Long Course (70.3-Mile Distance) from 2014 to 2024: 75K (2014) vs 55.6K (2024). From the peak in 2014, there has been a 26% decline in participation at the 70.3-mile distance. During the same period of time, Ironman has increased its market share from 56% (2014) to 86% (2024). When it comes to the 70.3-mile distance, athletes overwhelmingly chose Ironman with an average of 1713 finishes per race versus 105 finishes at a non-Ironman race. Ironman 70.3 Muncie was Ironman's weakest performer at 800 finishers. Even still, Muncie hosts approximately 250-300 more athletes than T100 Las Vegas & Door County Half, the most popular non-Ironman races at the long course distance. Ironman introduced the 70.3-mile distance in 2006 and it now outpaces the 140.6-mile distance by 3x.
– 38% Finisher Decline In Ultra or 140.6-Mile Distance from 2014 to 2024: 26K (2014) vs 16K (2024). 99% of finishes at this distance are at nine remaining Ironman events; California, Arizona, Wisconsin, Texas, Lake Placid, Maryland, Chattanooga and Florida. From the peak in 2024, there has been a 38% decline in participation at the 140.6-mile distance. It is a combination of less races and less participation at those races. It has been suggested that Ironman's 70.3-mile business has impacted their 140.6-mile business, but there is no publicly available information to confirm that premise.
Notes About the Data. In 2010, approximately 30K fast course finishes were identified as long course or 70.3-mile finishes. We included the data as not to impact the overall numbers but wanted to identify that as an issue. In addition, there are a small number of international races that have been included in the U.S. data.
| Total | 2010 | 2011 | 2012 | 2013 | 2014 | 2015 | 2016 | 2017 | 2018 | 2019 | 2020 | 2021 | 2022 | 2023 | 2024 |
|---|---|---|---|---|---|---|---|---|---|---|---|---|---|---|---|
| Total Finishes | 547,140 | 563,559 | 562,471 | 528,813 | 505,427 | 461,956 | 438,679 | 396,933 | 356,731 | 348,767 | 32,546 | 243,293 | 281,140 | 304,143 | 302,107 |
| Total Races | 1,470 | 1,640 | 1,667 | 1,608 | 1,539 | 1,406 | 1,327 | 1,214 | 1,130 | 1,100 | 181 | 752 | 862 | 1,018 | 996 |
| Average Finishers Per Race | 372 | 344 | 337 | 329 | 328 | 329 | 331 | 327 | 316 | 317 | 180 | 324 | 326 | 299 | 303 |
| Total Events | 2,213 | 2,671 | 2,833 | 2,942 | 2,948 | 2,881 | 2,925 | 2,782 | 2,777 | 2,765 | 500 | 2,046 | 2,442 | 2,619 | 2,480 |
| Average Events Per Race | 1.5 | 1.6 | 1.7 | 1.8 | 1.9 | 2.0 | 2.2 | 2.3 | 2.5 | 2.5 | 2.8 | 2.7 | 2.8 | 2.6 | 2.5 |
| Fast Course | 2010 | 2011 | 2012 | 2013 | 2014 | 2015 | 2016 | 2017 | 2018 | 2019 | 2020 | 2021 | 2022 | 2023 | 2024 |
| Total Finishes | 431,473 | 474,168 | 469,176 | 431,327 | 404,188 | 364,133 | 344,573 | 306,444 | 274,115 | 264,113 | 27,589 | 169,082 | 196,745 | 231,530 | 230,255 |
| Total Races | 1,388 | 1,577 | 1,591 | 1,540 | 1,463 | 1,336 | 1,262 | 1,145 | 1,074 | 1,042 | 176 | 697 | 796 | 954 | 937 |
| Average Finishers Per Race | 311 | 301 | 295 | 280 | 276 | 273 | 273 | 268 | 255 | 253 | 157 | 243 | 247 | 243 | 246 |
| Total Events | 1,923 | 2,510 | 2,565 | 2,636 | 2,600 | 2,556 | 2,609 | 2,488 | 2,484 | 2,508 | 442 | 1,834 | 2,214 | 2,345 | 2,268 |
| Average Events Per Race | 1.4 | 1.6 | 1.6 | 1.7 | 1.8 | 1.9 | 2.1 | 2.2 | 2.3 | 2.4 | 2.5 | 2.6 | 2.8 | 2.5 | 2.4 |
| Percent of total finishes that are short course | 79% | 84% | 83% | 82% | 80% | 79% | 79% | 77% | 77% | 76% | 85% | 69% | 70% | 76% | 76% |
| 70.3 Mile | 2010 | 2011 | 2012 | 2013 | 2014 | 2015 | 2016 | 2017 | 2018 | 2019 | 2020 | 2021 | 2022 | 2023 | 2024 |
| All Finishes | 98,228 | 67,294 | 69,259 | 73,858 | 74,977 | 71,706 | 68,416 | 67,290 | 61,165 | 63,684 | 4,704 | 59,360 | 63,047 | 58,542 | 55,637 |
| Ironman 70.3 Mile Total Finishes | 35,779 | 37,735 | 36,470 | 39,558 | 41,928 | 43,341 | 45,239 | 50,378 | 45,912 | 50,343 | 2,066 | 49,369 | 53,685 | 50,143 | 47,966 |
| Ironman 70.3 Mile Total Races | 23 | 25 | 25 | 24 | 25 | 28 | 28 | 32 | 28 | 30 | 3 | 32 | 34 | 34 | 28 |
| Ironman 70.3 Mile Average Per Race | 1,556 | 1,509 | 1,459 | 1,648 | 1,677 | 1,548 | 1,616 | 1,574 | 1,640 | 1,678 | 689 | 1,543 | 1,579 | 1,475 | 1,713 |
| Non-Ironman 70.3 Mile Total Finishes | 62,449 | 29,559 | 32,789 | 34,300 | 33,049 | 28,365 | 23,177 | 16,912 | 15,253 | 13,341 | 2,638 | 9,991 | 9,362 | 8,399 | 7,671 |
| Non-Ironman 70.3 Mile Races | 205 | 116 | 138 | 155 | 154 | 140 | 124 | 113 | 105 | 97 | 22 | 79 | 88 | 85 | 73 |
| Non-Ironman 70.3 Mile Finishers Per Race | 305 | 255 | 238 | 221 | 215 | 203 | 187 | 150 | 145 | 138 | 120 | 126 | 106 | 99 | 105 |
| Ironman 70.3 Mile Market Share | 36% | 56% | 53% | 54% | 56% | 60% | 66% | 75% | 75% | 79% | 44% | 83% | 85% | 86% | 86% |
| 140.6 Mile | 2010 | 2011 | 2012 | 2013 | 2014 | 2015 | 2016 | 2017 | 2018 | 2019 | 2020 | 2021 | 2022 | 2023 | 2024 |
| All Finishes | 17,439 | 22,097 | 24,036 | 23,628 | 26,262 | 26,117 | 25,690 | 23,199 | 21,451 | 20,970 | 253 | 14,851 | 21,348 | 14,071 | 16215 |
| Ironman Total Finishes | 14,651 | 18,922 | 20,710 | 20,126 | 23,015 | 23,549 | 24,444 | 22,119 | 20,464 | 20,213 | 0 | 14,532 | 20,990 | 13,788 | 15,993 |
| Ironman Races | 7 | 9 | 10 | 9 | 11 | 12 | 13 | 12 | 11 | 11 | 0 | 10 | 13 | 10 | 9 |
| Ironman Finishers Per Race | 2,093 | 2,102 | 2,071 | 2,236 | 2,092 | 1,962 | 1,880 | 1,843 | 1,860 | 1,838 | 0 | 1,453 | 1,615 | 1,379 | 1,777 |
| Non-Ironman Total Finishes | 2,788 | 3,175 | 3,326 | 3,502 | 3,247 | 2,568 | 1,246 | 1,080 | 987 | 757 | 253 | 319 | 358 | 283 | 222 |
| Non-Ironman Races | 13 | 17 | 27 | 40 | 30 | 25 | 22 | 22 | 19 | 19 | 5 | 10 | 16 | 11 | 6 |
| Non-Ironman Finishers Per Race | 214 | 187 | 123 | 88 | 108 | 103 | 57 | 49 | 52 | 40 | 51 | 32 | 22 | 26 | 37 |
| Ironman Market Share | 84% | 86% | 86% | 85% | 88% | 90% | 95% | 95% | 95% | 96% | 0% | 98% | 98% | 98% | 99% |